Future Value of Annuity Table: A Practical Guide to Using It
A future value of annuity table is one of the most useful tools in personal finance and accounting. It lets you calculate how much a series of equal payments will grow over time at a fixed interest rate. The future value annuity table works by listing pre-calculated factors for different interest rates and time periods. If you are specifically dealing with end-of-period payments, you need the future value of ordinary annuity table. The broader term future value of an annuity table covers both ordinary annuities and annuities-due. A future value chart can also display this data visually, making it easier to compare growth scenarios at a glance.
This guide shows you how to read these tables, when to use them, and how they fit into financial planning decisions.
How the Future Value Annuity Table Works
Reading Rows, Columns, and Factors
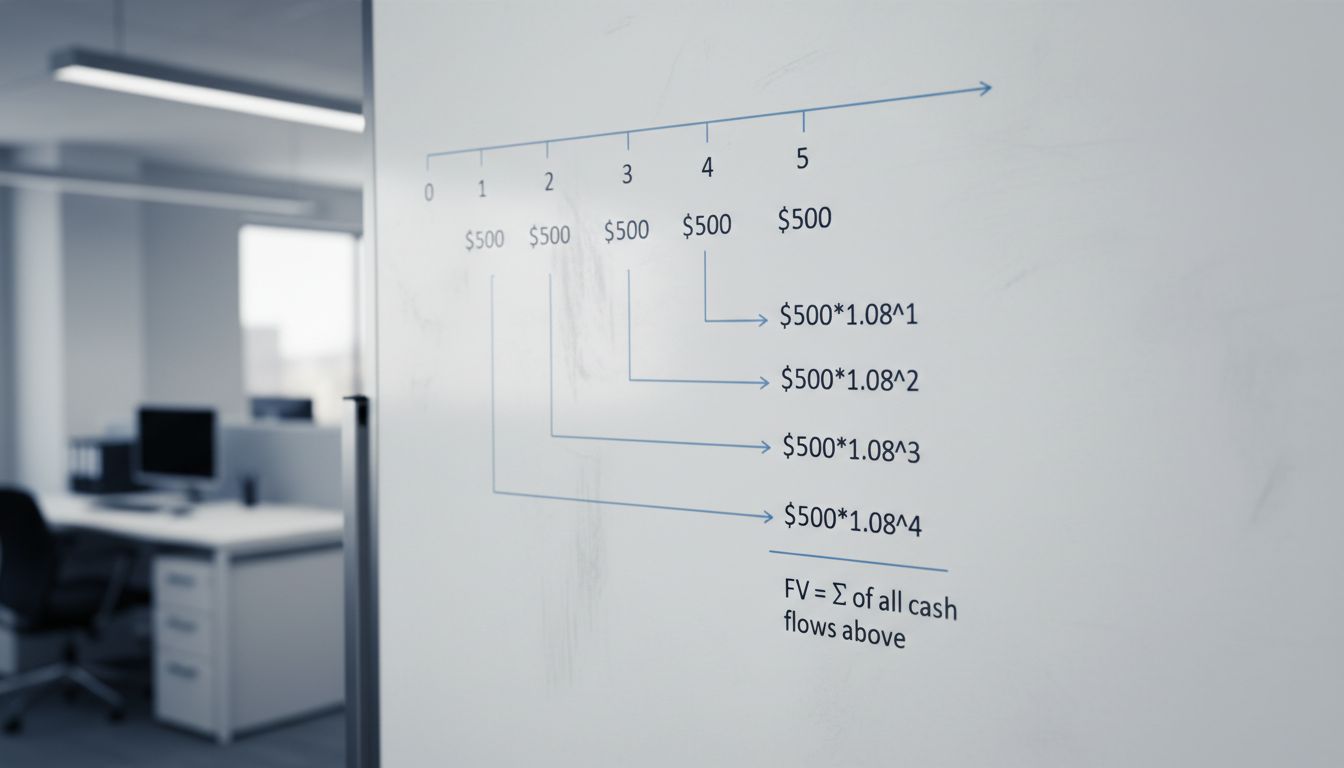
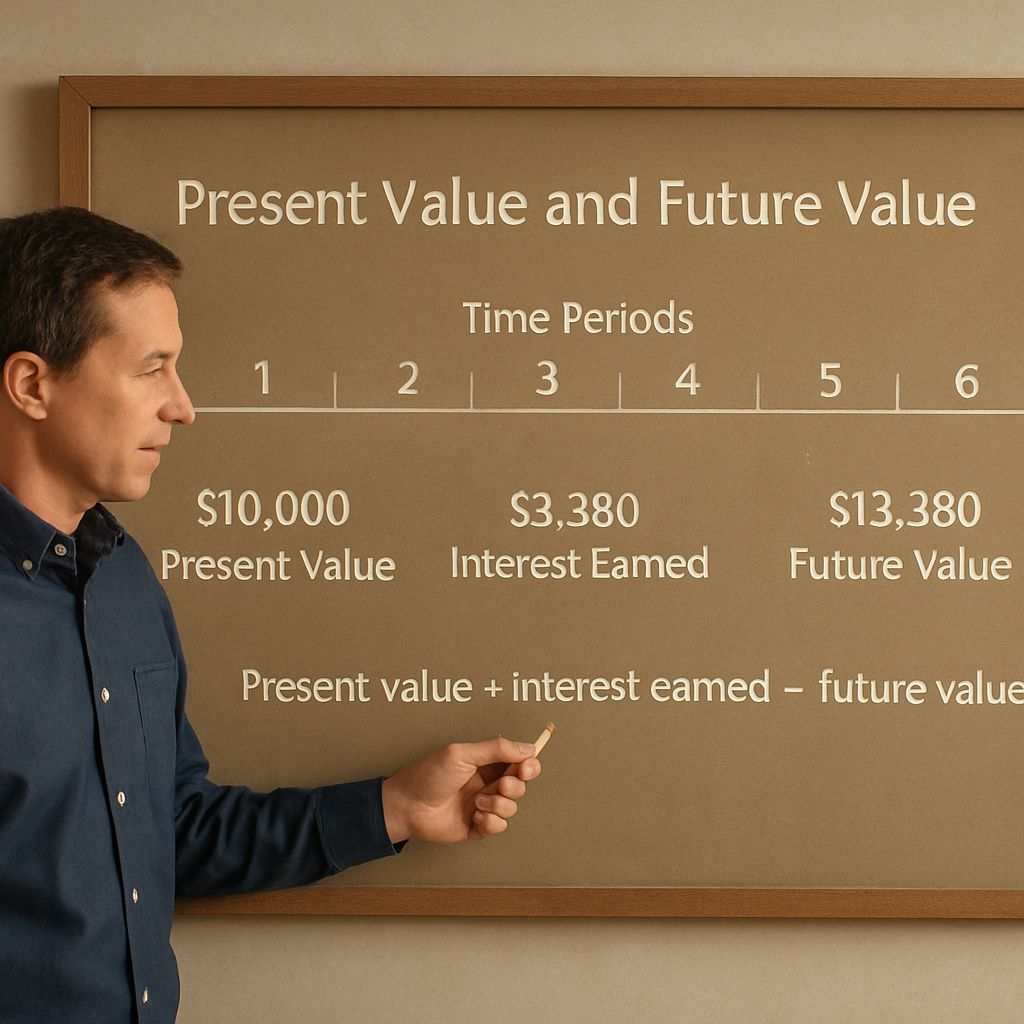
The future value annuity table is organized by interest rate across the top and number of periods down the side. Each cell contains a factor — a multiplier you apply to the payment amount to find the total future value. For example, if the factor is 5.637 and you pay $1,000 per period, the future value of your annuity is $5,637.
To use the future value of annuity table, you need three inputs: the periodic payment amount, the interest rate per period, and the total number of periods. Match the interest rate column with the number of periods row, read the factor, and multiply it by your payment amount. That is it — no financial calculator required for most straightforward problems.
The table assumes payments are equal and made at regular intervals. It does not account for variable rates or irregular payments. For those scenarios, you would use a spreadsheet formula or financial calculator instead.
Ordinary Annuity vs. Annuity-Due: Which Table to Use
Timing Changes the Factor
The future value of ordinary annuity table applies when payments are made at the end of each period. This is the most common setup — monthly mortgage payments, annual retirement contributions, and lease payments typically follow this pattern. The end-of-period assumption means each payment earns one less period of interest compared to an annuity-due.
An annuity-due has payments at the beginning of each period. The future value factors in an annuity-due table are always slightly higher because each payment earns one additional period of interest. If your payments occur at the start of the month rather than the end, you need the annuity-due version of the future value of an annuity table.
Getting this wrong produces a small but real error in your calculations. For a 30-year retirement saving plan, the difference between ordinary annuity and annuity-due factors can add up to thousands of dollars. Always confirm which type of annuity your situation represents before reading the table.
Using a Future Value Chart for Visual Comparison
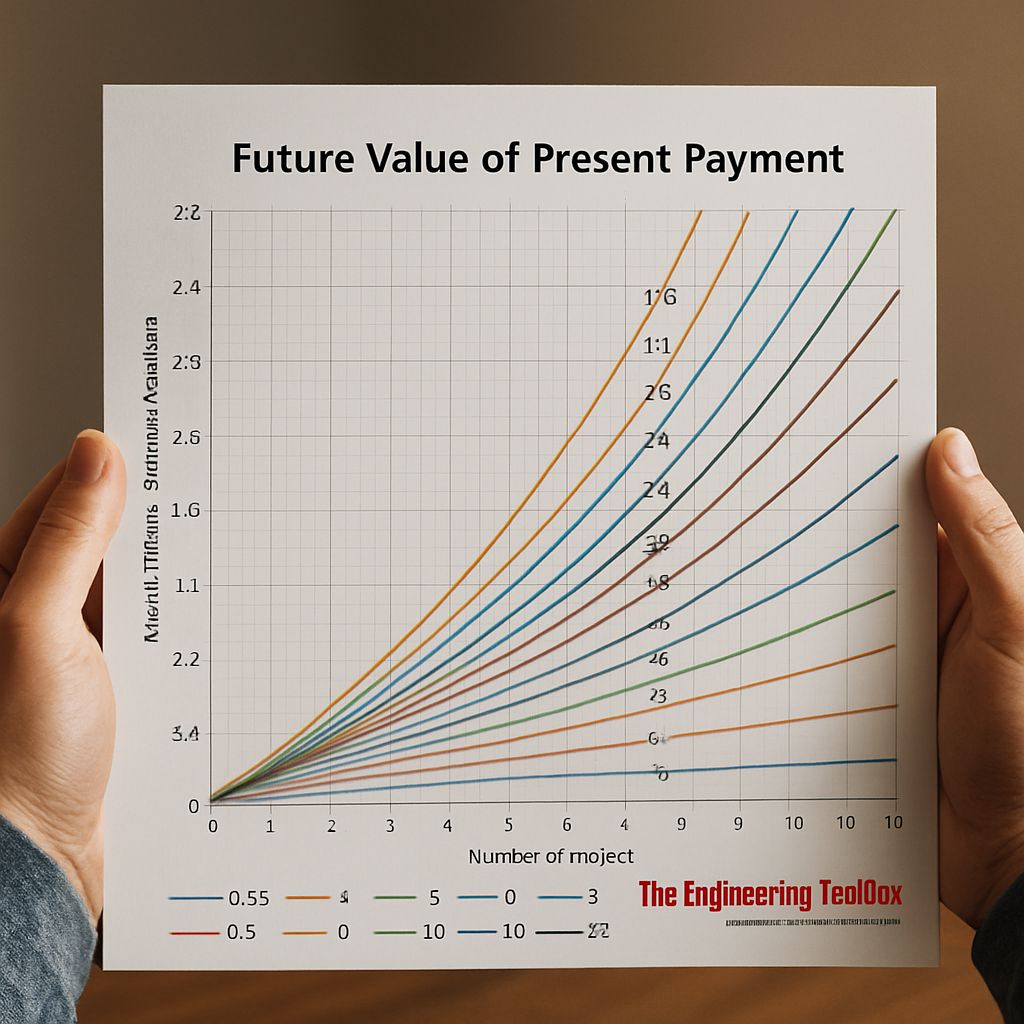
A future value chart presents the same data as a table but in graphical form. Bar charts or line graphs show how future value changes across interest rates or time periods side by side. This is useful when you are comparing two scenarios — for instance, contributing $500 per month for 20 years at 5% versus 7% interest.
Visual representations make the compounding effect immediately obvious. The lines diverge sharply as both time and interest rate increase, which is something that is harder to grasp from a grid of numbers. A future value chart is particularly effective in financial presentations and educational settings.
Many online financial tools generate these charts automatically. You enter your payment, rate, and period count, and the chart updates in real time. This gives you the same information as the annuity table but with an intuitive visual layer on top.
Applying the Table to Real Financial Decisions
The future value of ordinary annuity table is commonly used in retirement planning, loan analysis, and lease valuation. If you contribute $200 per month to a retirement account for 30 years at 6% annual interest (0.5% per month), you can use the table to find your expected balance without a calculator. This makes it a practical classroom and workplace tool for quick estimates.
Insurance companies and pension administrators use these tables routinely. Accountants use them to value lease obligations. Financial advisors use them to show clients the long-term impact of consistent saving. You can also use the future value of an annuity table in reverse — working backward from a target balance to find the required periodic payment.
Next steps: Pull up a future value annuity table online and try a calculation with your own numbers. Identify whether your situation calls for an ordinary annuity or annuity-due, find the matching factor, and multiply it by your payment amount. Then plot your results on a future value chart to see how different interest rates would change your outcome over time.